EXAMPLE 11.21 Price and the Number of Bedrooms
homes04
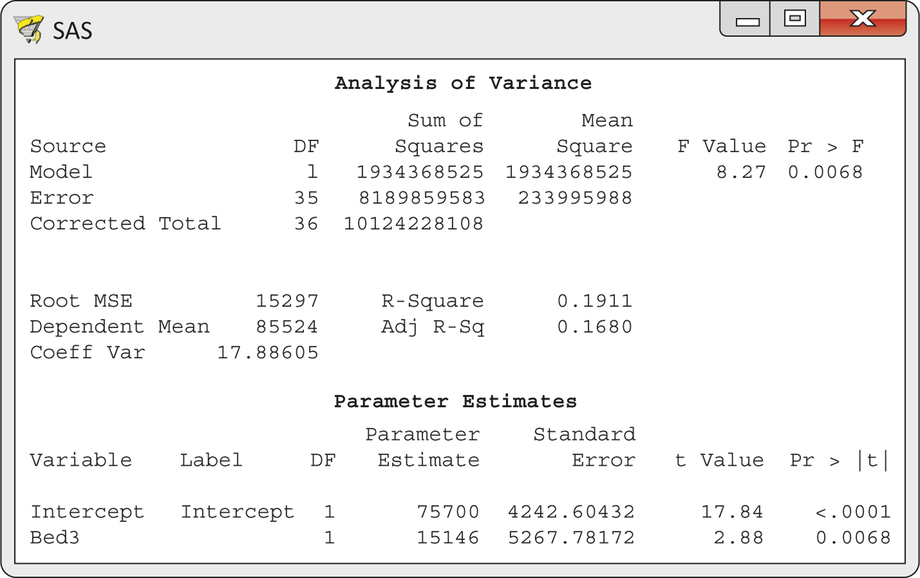
CASE 11.3 Figure 11.17 displays the output for the regression of Price on the indicator variable Bed3. This model explains 19% of the variation in price. This is about one-half of the 37.3% explained by SqFt, but it suggests that Bed3 may be a useful explanatory variable. The fitted equation is
^Price=75,700+15,146Bed3

The coefficient for Bed3 is significantly different from 0 (t=2.88, df=35, P=0.0068). This coefficient is the slope of the least-squares line. That is, it is the increase in the average price when Bed3 increases by 1. The indicator variable Bed3 has only two values, so we can clarify the interpretation.
The predicted price for homes with two or fewer bedrooms (Bed3=0) is
^Price=75,700+15,146(0)=75,700
That is, the intercept 75,700 is the mean price for homes with Bed3=0. The predicted price for homes with three or more bedrooms (Bed3=1) is
^Price=75,700+15,146(1)=90,846
That is, the slope 15,146 says that homes with three or more bedrooms are priced $15,146 higher on the average than homes with two or fewer bedrooms. When we regress on a single indicator variable, both intercept and slope have simple interpretations.