EXAMPLE 11.26 One More Model
homes04
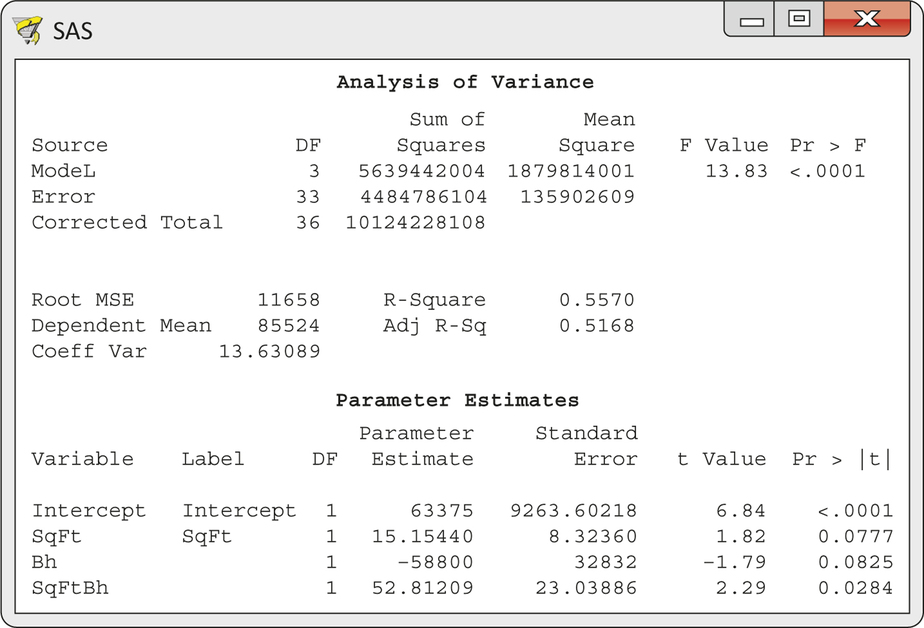
CASE 11.3 Figure 11.23 gives the output for the multiple regression of Price on SqFt, Bh, and the interaction between these variables. This model explains 55.7% of the variation in price. The coefficients for SqFt and Bh are significant at the 10% level but not at the 5% level (t=1.82, df=33, P=0.0777; and t=−1.79, df=33, P=0.0825). However, the interaction is significantly different from zero (t=2.29, df=33, P=0.0284). Because the interaction is significant, we keep the terms SqFt and Bh in the model even though their P-values do not quite pass the 0.05 standard. The fitted regression equation is
^Price=63,375+15.15SqFt−58,800Bh+52.81SqFtBh
Page 579
FIGURE 11.23 Output for predicting price using square feet, extra half bathroom, and the interaction, Example 11.26.

[Leave] [Close]