EXAMPLE 11.27 Interpretation of the Fit
homes04
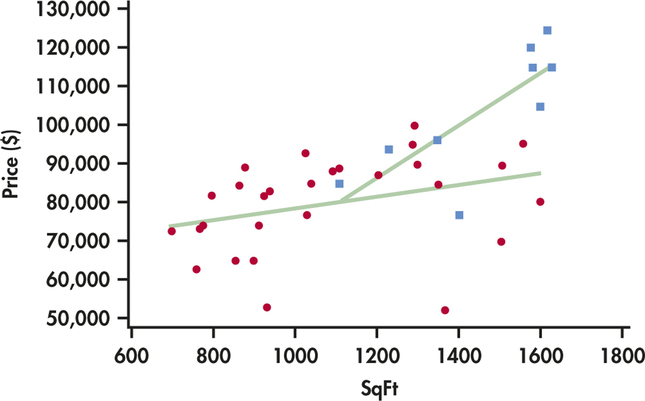
CASE 11.3 Figure 11.24 plots Price against SqFt, using different plot symbols to show the values of the categorical variable Bh. Homes without an extra half bath are plotted as circles, and homes with an extra half bath are plotted as squares. Look carefully: none of the smaller homes have an extra half bath.

Figure 11.24: FIGURE 11.24 Plot of the data and model for price predicted by square feet, extra half bathroom, and the interaction, Example 11.27.
580
The lines on the plot graph the model from Example 11.26. The presence of the categorical variable Bh and the interaction account for the two lines. That is, the model expresses the fact that the relationship between price and square feet depends on whether or not there is an additional half bath.