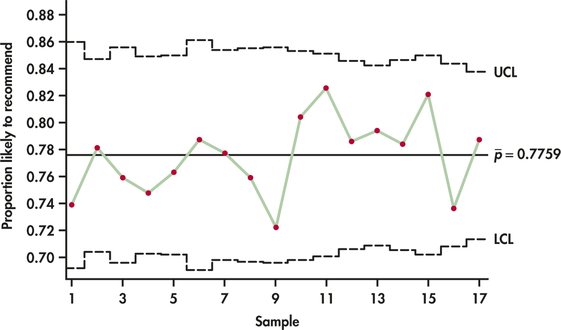
EXAMPLE 12.12 Patient Satisfaction Chart
bellin
Nationwide, health care organizations are instituting process improvement methods to improve the quality of health care delivery, including patient outcomes and patient satisfaction. Bellin Health (www.bellin.org) is a leader in the implementation of quality methods in a health care setting. Located in Green Bay, Wisconsin, Bellin Health serves nearly half a million people in northeastern Wisconsin and in the Upper Peninsula of Michigan. As part of its quality initiative, Bellin instituted a measurement control system of more than 250 quality indicators, which they later expanded to include more than 1200 quality indicators. Most of these quality indicators are monitored by control charts.
Table 12.9 gives the numbers of Bellin ambulatory (outpatient) surgery patients sampled each quarter for 17 consecutive quarters. Also provided is the number of patients out of each sample who said they would likely recommend Bellin to others for ambulatory surgery.10 The number of patients who would likely recommend Bellin can be divided by the sample size to give the sample proportion of patients who are likely to recommend Bellin. These proportions are also provided in Table 12.9.
The average quarterly proportion of patients likely to recommend Bellin is computed as follows:
The upper and lower control limits for each sample are given by
For the first recorded quarter, the control limits are
635
| Quarter | Patients likely to recommend | Total number of patients | Proportion |
| 1 | 164 | 222 | 0.7387 |
| 2 | 239 | 306 | 0.7810 |
| 3 | 186 | 245 | 0.7592 |
| 4 | 219 | 293 | 0.7474 |
| 5 | 219 | 287 | 0.7631 |
| 6 | 170 | 216 | 0.7870 |
| 7 | 199 | 256 | 0.7773 |
| 8 | 189 | 249 | 0.7590 |
| 9 | 177 | 245 | 0.7224 |
| 10 | 209 | 260 | 0.8038 |
| 11 | 227 | 275 | 0.8255 |
| 12 | 253 | 322 | 0.7857 |
| 13 | 278 | 350 | 0.7943 |
| 14 | 247 | 315 | 0.7841 |
| 15 | 234 | 285 | 0.8211 |
| 16 | 251 | 341 | 0.7361 |
| 17 | 319 | 405 | 0.7877 |
Figure 12.19 displays the chart for all the proportions. Notice first that the control limits are of varying widths. The sample proportions are behaving as an in-control process around the center line with no out-of-control signals. Even though the stability of the process implies that Bellin is sustaining a fairly high level of satisfaction, management's goal is no doubt to find ways to increase satisfaction to even higher levels and thus cause an upward trend or upward shift in the process.
