EXAMPLE 12.13 Work Safety c Chart
safety
State and federal laws require employers to provide safe working conditions for their workers. Beyond the legal requirements, many companies have implemented process improvement measures, such as Six-Sigma methods, to improve worker safety.
| Month: | 1 | 2 | 3 | 4 | 5 | 6 | 7 | 8 | 9 | 10 | 11 | 12 |
| Injuries: | 12 | 6 | 6 | 10 | 5 | 2 | 6 | 5 | 5 | 4 | 6 | 6 |
| Month: | 13 | 14 | 15 | 16 | 17 | 18 | 19 | 20 | 21 | 22 | 23 | 24 |
| Injuries: | 16 | 9 | 10 | 5 | 7 | 3 | 5 | 7 | 12 | 4 | 4 | 6 |
Companies recognize that such efforts have beneficial effects on employee satisfaction and reduce liability and loss of workdays, all of which can improve productivity and corporate profitability. For a manufacturing facility, Table 12.10 provides 24 months of the counts of Occupational Safety and Health Administration (OSHA) reportable injuries.
The average monthly number of injuries is calculated as follows:
ˉc=12+6+⋯+624=16124=6.7083
The center line and control limits are given by
UCL=ˉc+3√ˉc=6.7083+3√6.7083=14.48CL=ˉc=6.7083LCL=ˉc−3√ˉc=6.7083−3√6.7083=−1.06→0
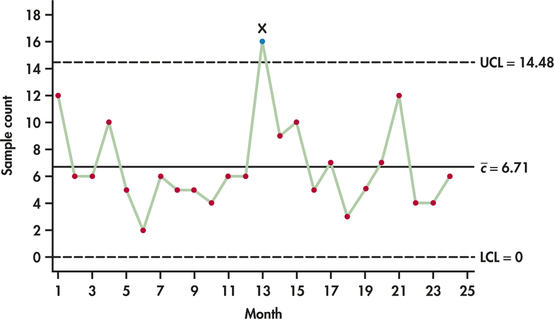
Figure 12.20 shows the sequence plot of the counts along with the previously computed control limits. We can see that the 13th count falls above the upper control limit. This unusually high number of injuries is a signal for management investigation. If a special cause can be found for the out-of-control signal, then the associated observation should be removed from the preliminary data and the control limits should be recomputed. We leave the recomputation of this c chart application to Exercise 12.43.
