EXAMPLE 12.4 and Charts
lab
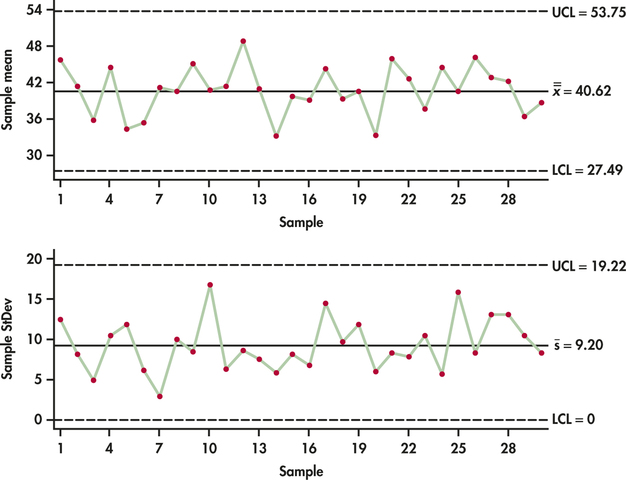
CASE 12.1 We leave the actual specific computations of the and charts for the lab-testing data to Exercise 12.15. Figure 12.10 shows the and charts produced by software. Comparing these control charts with the and charts of Figures 12.3 and 12.4 (pages 606 AND 607), we are left with the same conclusion: the lab-testing process is in control in terms of both level and variability.
614

Figure 12.10: FIGURE 12.10 and charts for the lab-testing data of Table 12.2.