EXAMPLE 12.5 Is LeBron in Control?
lebron1
Sports enthusiasts use a variety of statistics to prognosticate team and player performance for general entertainment, betting purposes, and fantasy league play. Indeed, there are literally hundreds of thousands of websites providing sports statistics on amateur and professional athletes and teams. Let us consider the performance of the professional basketball superstar LeBron James during the 2013-2014 season. Basketball players can be tracked on a variety of offensive and defensive measures. The number of minutes played from game to game varies, so it makes sense to consider measures in terms of a rate, such as points per minute or rebounds per minute.
Table 12.5 provides the points per minute (ppm) that LeBron had for each of the 77 consecutive regular-season games he played in.7 The sample mean for the 77 observations is
ˉx=0.44717+0.68244+⋯+1.03250+0.7228977=0.718310
| 0.44717 | 0.68244 | 0.61563 | 0.72081 | 0.97177 | 0.48452 | 0.68431 | 1.10122 |
| 1.05500 | 0.93995 | 0.42345 | 0.72206 | 0.58537 | 1.04948 | 0.75472 | 0.74074 |
| 0.67944 | 0.62218 | 0.63063 | 0.68702 | 0.68539 | 0.44118 | 0.61551 | 0.88714 |
| 0.66237 | 0.58696 | 0.83272 | 0.53073 | 0.75486 | 0.65436 | 0.65712 | 0.41763 |
| 0.79400 | 0.90780 | 0.77264 | 0.72924 | 0.60877 | 0.57508 | 0.75780 | 0.77486 |
| 0.74742 | 0.72386 | 0.64943 | 0.80632 | 0.76726 | 0.62636 | 0.76011 | 0.33037 |
| 0.90281 | 0.85174 | 1.09185 | 0.98802 | 0.84622 | 0.64068 | 1.48058 | 0.60055 |
| 0.49912 | 0.37514 | 0.62585 | 0.49934 | 0.52720 | 0.55988 | 1.03200 | 0.39456 |
| 0.59547 | 0.83406 | 0.87558 | 0.57111 | 0.43261 | 0.82297 | 0.57922 | 0.70907 |
| 0.88820 | 0.78097 | 0.89444 | 1.03250 | 0.72289 |
The mean moving range is
¯MR=|0.68244−0.44717|+⋯+|0.72289−1.03250|76=0.201704
The center line and control limits for the I chart are
UCL=ˉx+2.66¯MR=0.718310+2.66(0.201704)=1.25484CL=ˉx=0.718310LCL=ˉx−2.66¯MR=0.718310−2.66(0.201704)=0.18178
The center line and control limits for the MR chart are
UCL=3.267¯MR=3.267(0.201704)=0.65897CL=¯MR=0.201704LCL=0
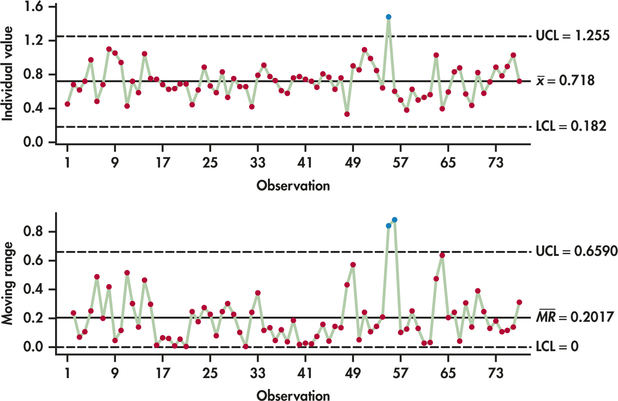
Figure 12.11 displays both the I and the MR chart. For the most part, the I chart shows a process that is stable around the center line. There is, however, a three-sigma signal with observation 55. In that game on March 3, 2014, Lebron scored 1.481 points per minute, which is much greater than expected by the upper control limit. Investigation of observation 55 reveals that Lebron scored, to date, a career high of 61 points. After the game, LeBron was quoted saying, “It felt like I had a golf ball, throwing it into the ocean.”
The MR chart reacts with two consecutive signals. The reason being is that there was a big jump up from observation 54 to 55 and then a big drop down from observation 55 to 56. As a result, the consecutive moving ranges are unusually large. Aside from LeBron's record performance, the control charts show that LeBron's offensive performance is an in-control process. This does not mean that we can predict his future individual game outcomes precisely, but rather it means that the level and average variability of his performance can be predicted with a high degree of confidence.
