EXAMPLE 12.6 Capability
lab
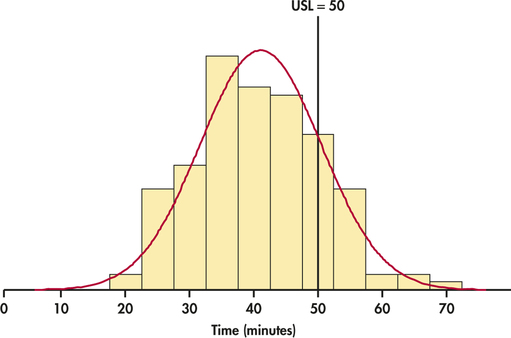
CASE 12.1 Both the and charts and the and charts showed that the lab-testing process is stable and in control. Suppose that the ER stipulates that getting lab results must take no longer than 50 minutes. Figure 12.13 compares the distribution of individual lab test times with an upper specification limit (USL) of 50 minutes. We can clearly see that the process is not capable of meeting the specification.
620

Figure 12.13: FIGURE 12.13 Comparing the distribution of individual lab test turnaround times with an upper specification limit, Example 12.6.