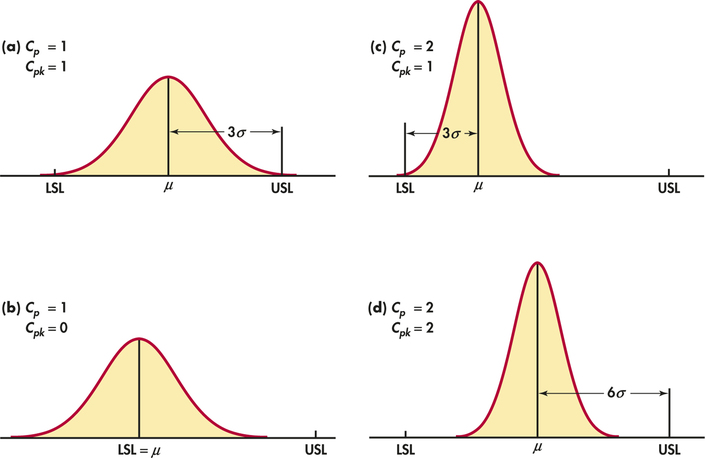
EXAMPLE 12.8 Interpreting Capability Indices
Consider the series of pictures in Figure 12.15. We might think of a process that machines a metal part. Measure a dimension of the part that has LSL and USL as its specification limits. There is, of course, variation from part to part. The dimensions vary Normally with mean and standard deviation .
Figure 12.15(a) shows process width equal to the specification width. That is, . Almost all the parts will meet specifications if, as in this figure, the process mean is at the center of the specs. Because the mean is centered, it is from both LSL and USL, so also. In Figure 12.15(b), the mean has moved down to LSL. Only half the parts will meet the specifications. is unchanged because the process width has not changed. But sees that the center is right on the edge of the specifications, . The value becomes negative if is outside the specifications.
623

In Figures 12.15(c) and (d), the process has been reduced to half the value it had in Figures 12.15 (a) and (b). The process width is now half the specification width, so . In Figure 12.15(c), the center is just 3 of the new 's above LSL, so that . Figure 12.15(d) shows the same smaller accompanied by mean correctly centered between LSL and USL. rewards the process for moving the center from to away from the nearer limit by increasing from 1 to 2. You see that and are equal if the process is properly centered. If not, is smaller than .