EXAMPLE 12.9 O-Ring Process Capability
oring
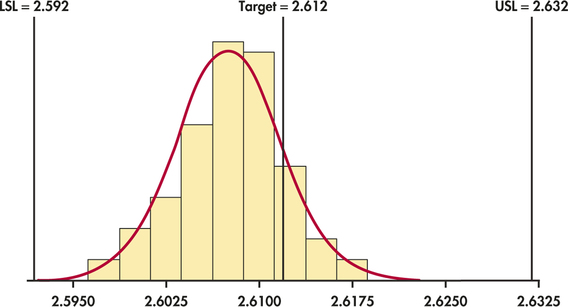
CASE 12.2 At the conclusion of the process study in Example 12.3 (pages 610–612), we found two special causes and eliminated from our data the subgroups on which those causes operated. From Figure 12.9 (page 612), after removal of the two subgroups, we find ˉˉx=2.60756 and ˉR=0.00899. As noted in Case 12.2 (page 609), specification limits for the inside diameter are set at 2.612±0.02 inches, which implies LSL=2.592 and USL=2.632. Figure 12.16 shows that the individual measurements are compatible with the Normal distribution.

From Table 12.1 (page 603), we find d2=2.059 for n=4, which gives the estimate for σ
ˆσ=0.008992.059=0.004366
In addition, the mean estimate ˆμ is simply the grand mean ˉˉx. These estimates may be quite accurate if we have data on many past samples.
Estimates based on only a few observations may, however, be inaccurate because statistics from small samples can have large sampling variability. This important point is often not appreciated when capability indices are used in practice. To emphasize that we can only estimate the indices, we write ˆCp and ˆCpk for values calculated from sample data. They are
ˆCp=USL−LSL6ˆσ=2.632−2.592(6)(0.004366)=1.53ˆCpk=min(ˆμ−LSL3ˆσ,USL−ˆμ3ˆσ)=min(2.60756−2.592(3)(0.004366),2.632−2.60756(3)(0.004366))=min(1.19,1.87)=1.19
Both indices are well above 1, which indicates that we have a highly capable process. However, the fact that ˆCpk is markedly smaller than ˆCp indicates that the process is off target. Indeed, a close look at Figure 12.16 shows that the center of the distribution is to the left of the center of the specs. If we can adjust the center of the process distribution to the target of 2.612, then ˆCpk will increase and will equal ˆCp.