EXAMPLE 13.10 Honda Prices over a Longer Horizon
honda2
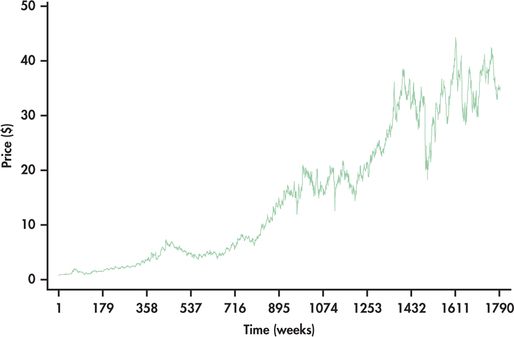
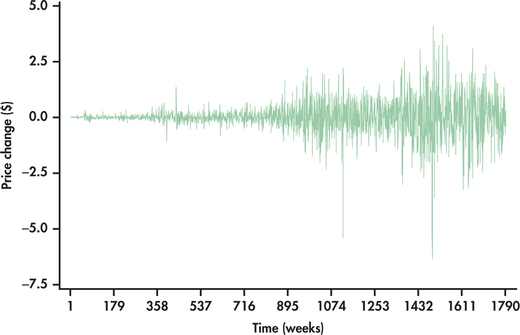
In Example 13.9, we looked at weekly closing prices over an approximate five-year horizon. Consider now the weekly closing prices over a time horizon of more than three decades through the end of July 2014. The price series is shown in Figure 13.16. We can see that the prices started out near 0 and have increased to the range of 30 to 40. Figure 13.17 shows the price changes over this longer time horizon. Though the price changes appear random over time, the salient point with the graph is that the variation of the price changes is increasing substantially with time.
FIGURE 13.16 Weekly closing prices of Honda stock (March 1980 through July 2014).

Page 662
FIGURE 13.17 Weekly price changes (first differences) of Honda stock (March 1980 through July 2014).

[Leave] [Close]