EXAMPLE 13.11 Honda Returns by Means of Log Transformation
honda2
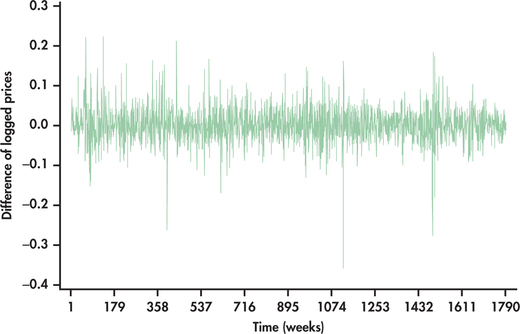
To approximate the percent changes of Honda prices, we first take the log of prices. We then take the differences of the logged values. The differences can be either left in decimal form or multiplied by 100 to be in the form of a percent. Figure 13.18 shows the differences of logged Honda prices left in decimal form. Compare this time plot with the price changes of Figure 13.17. We can clearly see that the returns approximated by the log transformation have much more constant variance. The vertical axis is directly interpretable. For example, we find that weekly returns have dropped as much as 35% and have had increases greater than 20%.
663

Figure 13.18: FIGURE 13.18 Weekly changes (first differences) of logged Honda stock prices (March 1980 through July 2014).