EXAMPLE 13.13 LinkedIn Members
linked
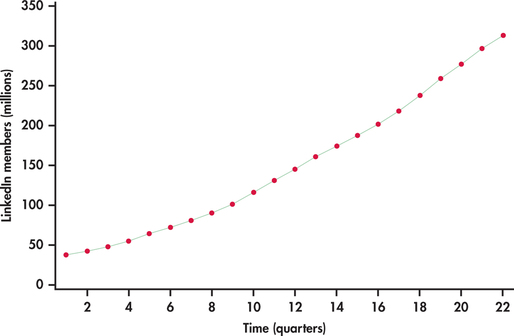
LinkedIn is the largest professional networking service. Unlike Facebook, LinkedIn is a business-oriented social network allowing its members to place online resumes and to connect with other members for career opportunities. Figure 13.22 shows the number of LinkedIn members (in millions) by quarter starting from the first quarter of 2009 and ending with the second quarter of 2014.11
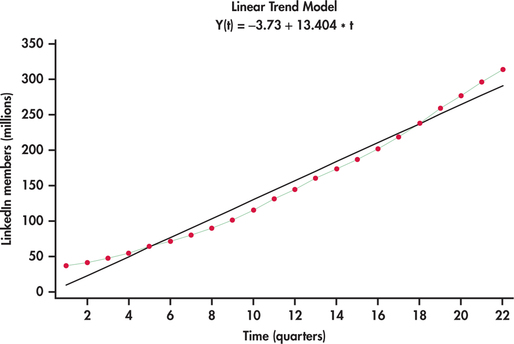
The number of members are clearly increasing with time. However, the trend appears not to be linear. Created using Excel’s trendline option with charts, Figure 13.23 shows a linear trend fit to the LinkedIn series. It is clear that the linear trend model fit is systematically off. The linear model is not able to capture the curvature in the series. One possible approach to fitting curved trends is to introduce the square of the time index to the model:
ˆyt=b0+b1t+b2t2


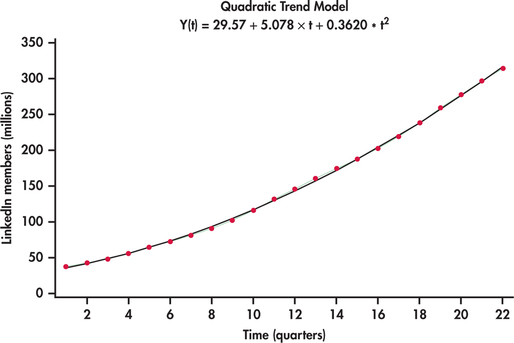
Such a fitted model is known as a quadratic trend model. Figure 13.24 shows the best-fitting quadratic trend model. In comparison to the linear trend model, the quadratic trend model fits the data series remarkably well.
quadratic trend model
