EXAMPLE 13.14 Chinese Car Ownership
china
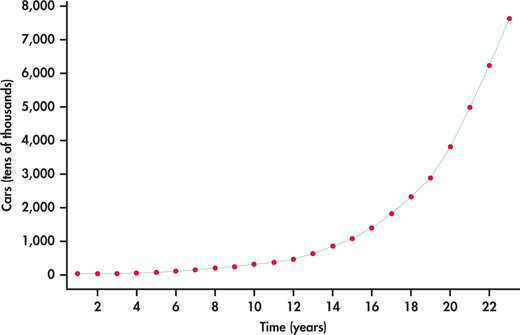
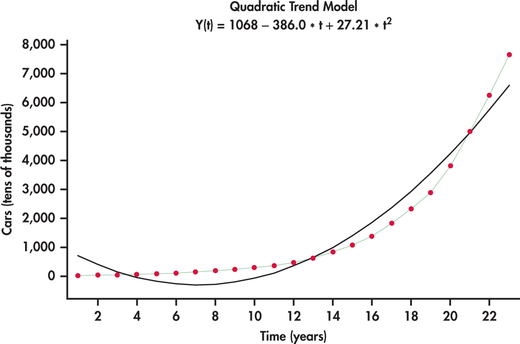
China’s rapid economic growth can be measured on numerous dimensions. Consider Figure 13.25, which shows the time plot of the number of passenger cars owned (in tens of thousands) in China from 1990 to 2012.12 What we see is an increasing rate of growth with time. Figure 13.26 shows the best-fitting quadratic trend model. It is clear that a quadratic model does not follow the growth pattern well.


exponential trend model
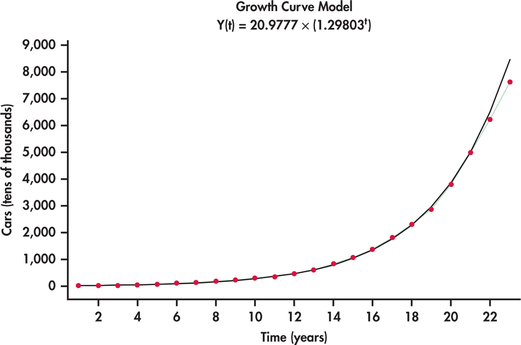
An alternative model that is often well suited to rapidly growing (or decaying) data series is an exponential trend model. Figure 13.27 shows the China car ownership data with an exponential trend superimposed. This model does a much nicer job than the quadratic model in tracking the growth in passenger car ownership. Minitab reports the estimated exponential trend to be
ˆyt=20.9777(1.29803t)
The estimated model has direct interpretation on the growth rate. In particular, as the time index t increases by one unit, we multiply the estimate for the number of cars from the previous year by 1.29803. This implies that the yearly growth rate in the number of passenger cars is estimated to be 29.8%. However, it appears that actual growth might be slowing down in that the exponential fit is over predicting by a bit in years 2011 and 2012. As more data come in, it will be important to monitor the forecasts relative to actual observations. When the forecasts are consistently off, this is a critical signal to reestimate the trend model.

If the exponential trend fit option were done in Excel, Excel would report the fit as:
ˆyt=20.9777e0.26085t
The mathematical constant e was introduced in Chapter 5 with the Poisson distribution on page 268. We see here that the reported models are the same in the end:
ˆyt=20.9777e0.26085t=20.9777(e0.26085)t=20.9777(1.29803t)