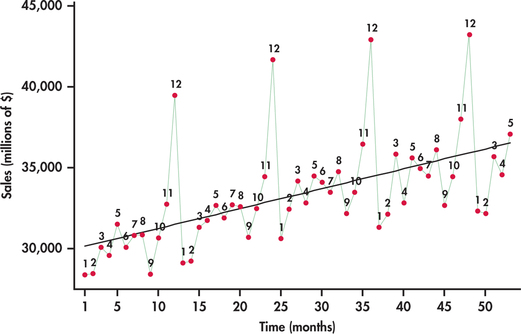
EXAMPLE 13.15 Monthly warehouse Club and Superstore Sales
club
The Census Bureau tracks a variety of retail and service sales using the Monthly Retail Trade Survey.14 Consider, in particular, monthly sales (in millions of dollars) from January 2010 through May 2014 for warehouse clubs (for example, Costco, Sam’s Club, and BJ’s Wholesale Club) and superstores (for example, Target and Walmart).
Figure 13.28 plots monthly sales with the months labeled “1” for January, “2” for February, and so on. The plot reveals interesting characteristics of sales for this sector:
- Sales are increasing over time. The increase is reflected in the superimposed trend line fit.
- A distinct pattern repeats itself every 12 months: January, February, and September sales are consistently below the trend line; sales pick up in the spring months and seem to level off; and, finally, there is an initial increase in November sales followed by a more dramatic increase to a peak in December.
A trend line fitted to the data in Figure 13.28 ignores the seasonal variation in the sales time series. Because of this, using a trend model to forecast sales for, say, December 2015 will most likely result in a gross underestimate because the line underestimates sales for all the Decembers in the data set. We need to take the month-to-month pattern into account if we wish to accurately forecast sales in a specific month.
672
