EXAMPLE 13.19 Residual Analysis of Amazon Sales Model
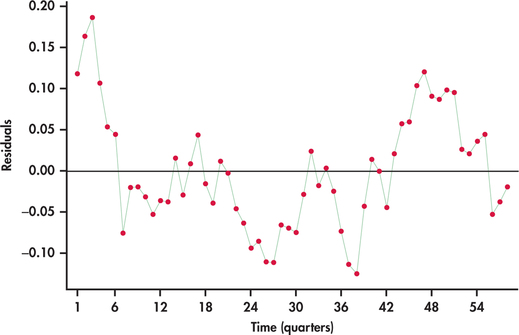
CASE 13.1 Figure 13.33 plots the residuals from the trend-and-season regression model for logged Amazon sales given in Example 13.18. Notice the pattern of long runs of positive residuals and long runs of negative residuals. The residual series appears to “snake” or “meander” around the mean line. This appearance is due to the fact that successive observations tend to be close to each other. A precise technical term for this behavior is positive autocorrelation.
positive autocorrelation

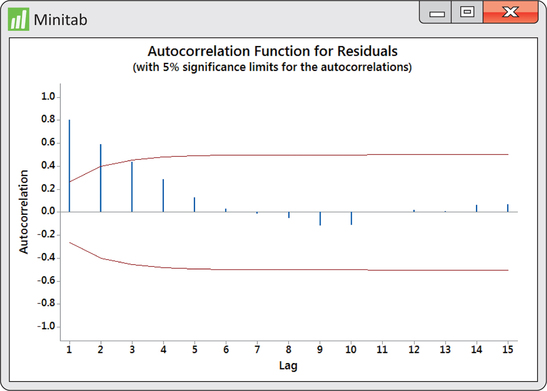
Our visual impression of nonrandomness is confirmed by the ACF of the residuals shown in Figure 13.34. We see that the first two autocorrelations are positive and significant. Furthermore, the remaining autocorrelations show a pattern within the ACF significance limits.
