EXAMPLE 13.21 Fitting FedEx Trading Volumes
fedex
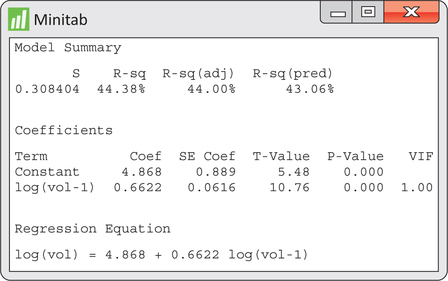
Figure 13.38 displays regression output for the estimated AR(1) fitted model of logged volumes. In summary, the fitted model is given by

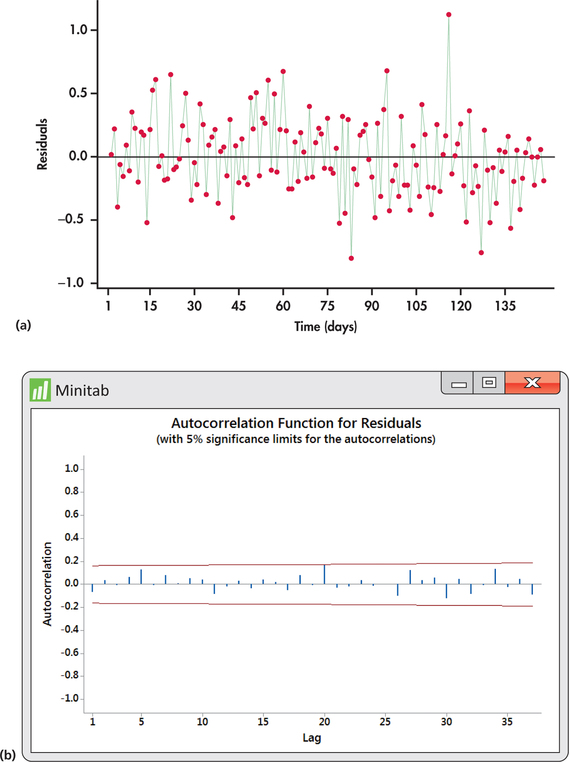
To check the adequacy of the AR(1) fitted model, we turn our attention to the time plot of residuals in Figure 13.39(a). The residuals show a mix of short runs and some oscillation with no strong tendency toward one or the other behavior. The ACF of residuals shown in Figure 13.39(b) confirm that the residuals are indeed consistent with randomness.
685

The log volume series ends with , which is slightly less than the overall mean of 14.4292. The forecast for the next day log volume is
Notice that the forecast of 14.2599 is slightly greater than the observed value of 14.1829. The forecast reflects the tendency of the series to revert back to the overall mean.