EXAMPLE 13.24 Fitting Lake Levels
lakes
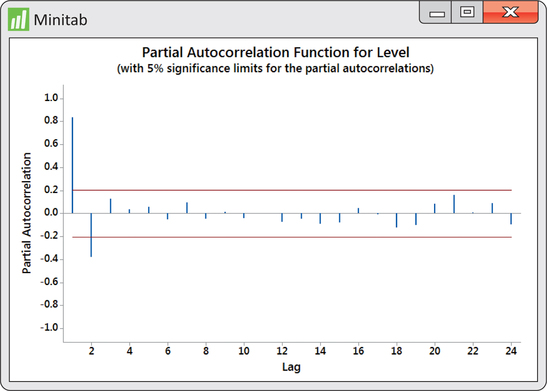
To determine how many lags we should introduce to the model, we obtain the PACF shown in Figure 13.42. The PACF shows that both lag one and lag two correlations are significant. As such, we create a lag one and lag two variable to estimate an AR(2) model. We find the following estimated model:
688

Figure 13.42: FIGURE 13.42 Minitab PACF of lake levels.
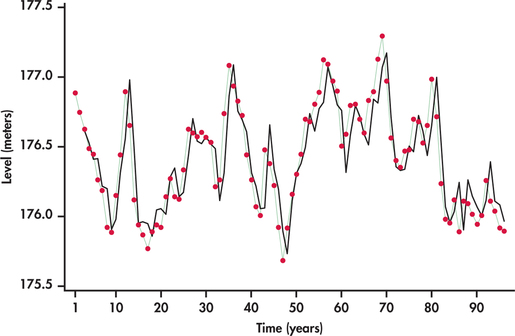
The residuals from this fit show random behavior, indicating that the AR(2) is a good model for the data. Figure 13.43 shows that the AR(2) model does a nice job tracking the water levels over time.

Figure 13.43: FIGURE 13.43 AR(2) fitted model superimposed on annual lake levels.