EXAMPLE 13.28 Light Rail Usage and Centered Moving Averages
rail
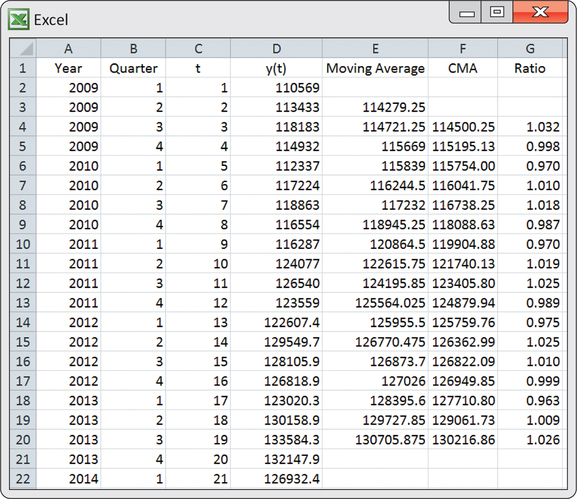
Excel is a convenient way to manually compute the moving averages and centered moving averages. Figure 13.47 shows a screenshot of the Excel computations for the light rail usage data. The first moving average of 114279.25 is computed as the average of the first four periods. In terms of the Excel spreadsheet shown in Figure 13.47, enter
in cell E3 and copy the formula down to cell E20. As a result, we find that the second moving average of 114721.25 is computed as the average of periods 2 through 5. The first centered moving average is then
This value can be seen in the spreadsheet and was obtained by entering
in cell F4. This first centered moving average is properly sitting on . The remaining centered moving averages can be found by copying the formula in cell F4 down to cell F20. The last moving average found in cell E20 involves periods 18 through 21, and it represents . The next-to-last moving average in cell E19 represents . The average of these two averages gives the last shown centered moving average of 130216.86 (cell F20), which represents .
696

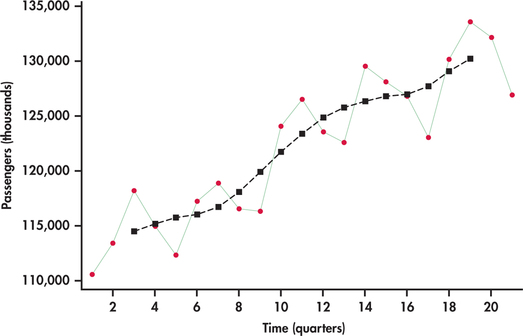
Figure 13.48 shows the centered moving averages plotted on the passenger series. Similar to Figure 13.46, the averages show the general trend. However, unlike Figure 13.46, these averages are shifted back in time to provide an estimate of where the level of the process was as opposed to a forecast of where the process might be.
