EXAMPLE 13.31 PMI Index Series
pmi
On the first business day of each month, the Institute for Supply Management (ISM) issues the ISM Manufacturing Report on Business. This report is viewed by many economists, business leaders, and government agencies as an important short-term economic barometer of the manufacturing sector of the economy. In the report, one of the economic indicators reported is the PMI index. The acronym PMI originally stood for Purchasing Manager’s Index, but ISM now only uses the acronym without any reference to its past meaning.
PMI is a composite index based on a survey of purchasing managers at roughly 300 U.S. manufacturing firms. The components of the index relate to new orders, employment, order backlogs, supplier deliveries, inventories, and prices. The index is scaled as a percent—a reading above 50% indicates that the manufacturing economy is generally expanding, while a reading below 50% indicates that it is generally declining.
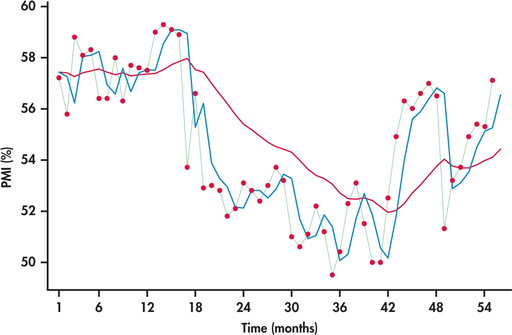
Figure 13.51 displays the monthly PMI values from January 2010 through July 2014.28 Also displayed are the forecasts from the exponential smoothing with and .
The PMI series shows a meandering movement due to successive observations tending to be close to each other. Earlier, we referred to this behavior as positive autocorrelation (page 678). With successive observations being close, it would seem intuitive that a larger smoothing constant would work better for tracking and forecasting the series. Indeed, we can see from Figure 13.51 that the forecasts based on track much closer to the PMI series than the forecasts based on . With a smoothing constant of 0.1, the model smoothes out much of the movement (both short term and long term) in the series. As a result, the forecasts react slowly to momentum shifts in the series.
701
