EXAMPLE 13.5 Lag One and Two Autocorrelations for Disney Returns
disney
Reminder

correlation test, p. 501
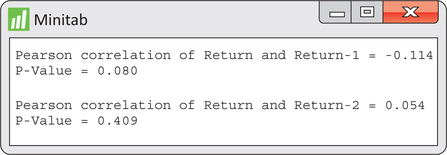
Figure 13.9 shows the sample lag one and lag two autocorrelations, computed by Minitab. The output also provides the -values for testing the null hypothesis that the population correlation is 0. We find for each autocorrelation, the associated -value is not significant at the 5% level of significance. Thus, for either lag, there is not strong enough evidence to reject the null hypothesis of underlying correlation of 0.

Figure 13.9: FIGURE 13.9 Minitab output of lag one and lag two correlations for Disney returns data.