EXAMPLE 13.7 ACF for Amazon Sales
disney
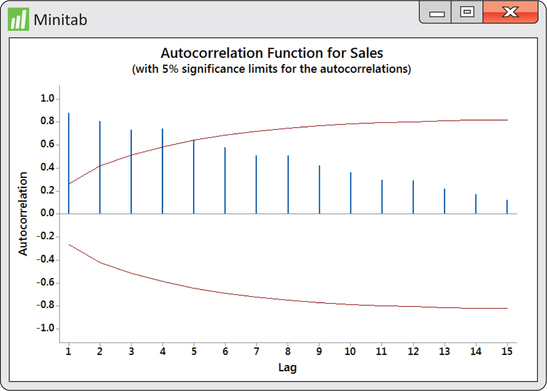
In contrast to the ACF output of Figure 13.10, the ACF of Figure 13.11 leaves us with a very different impression about the time series in question. We find that the first four sample autocorrelations go beyond the significance limits. Furthermore, the remaining sample autocorrelations show a block-like pattern. The sample autocorrelations for a random process are expected to “swim” between the limits with no pattern as seen in the Disney returns ACF of Figure 13.10. In the end, the ACF for the Amazon sales series is providing us with strong evidence that the underlying process generating the observations is not random.

Figure 13.11: FIGURE 13.11 Minitab ACF output for the Amazon sales series.