EXAMPLE 13.9 Honda Prices
honda1
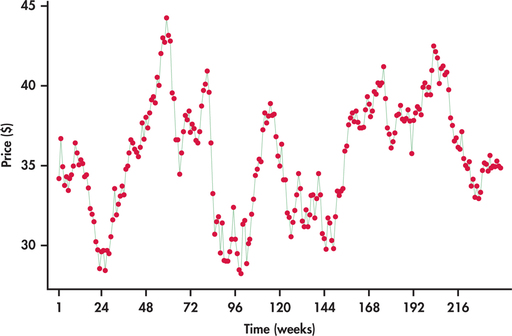
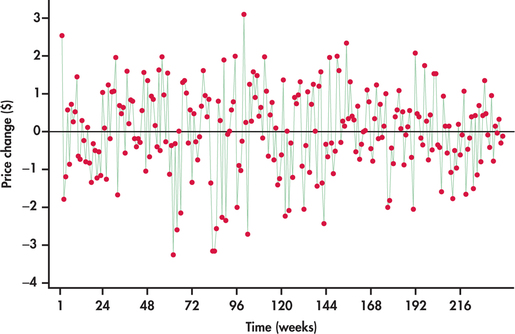
Figure 13.14 plots the weekly closing stock prices of Honda Motor Co. from the beginning of January 2010 through the end of July 2014.5 We can see that the prices are meandering around, much like the green line series of Figure 13.13. The price series is clearly not random. Now consider the first differences of the prices shown in Figure 13.15. The average price change is 0.0029. The price changes are demonstrating random behavior around the average, which implies that the Honda price series is well described by the random walk model.
FIGURE 13.14 Weekly closing prices of Honda stock (January 2010 through July 2014).

Page 660
FIGURE 13.15 Weekly price changes (first differences) of Honda stock (January 2010 through July 2014).

[Leave] [Close]