EXAMPLE 14.15 Are the Comprehension Scores Different?
eduprod
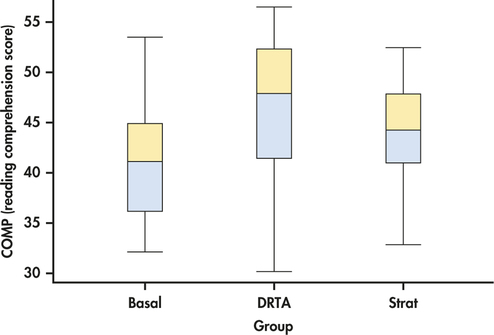
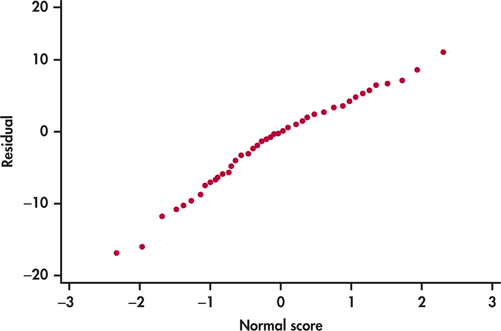
CASE 14.2 Figure 14.11 gives the summary statistics for COMP computed by SPSS. This software uses only numeric values for the factor, so we coded the groups as 1 for Basal, 2 for DRTA, and 3 for Strat. Side-by-side boxplots appear in Figure 14.12, and Figure 14.13 plots the group means. The ANOVA results generated by SPSS are given in Figure 14.14, and a Normal quantile plot of the residuals appears in Figure 14.15.
FIGURE 14.11 Summary statistics for the comprehension scores in the three groups for the new-product evaluation study of Case 14.2.
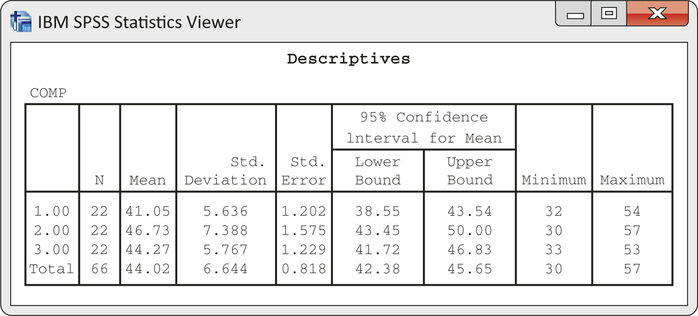
FIGURE 14.12 Side-by-side boxplots of the comprehension scores in the new-product evaluation study of Case 14.2.
Page 735
FIGURE 14.13 Comprehension score group means in the new-product evaluation study of Case 14.2.
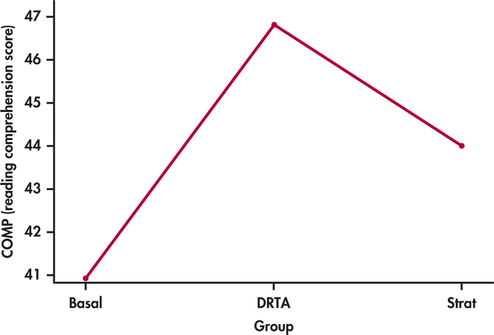
FIGURE 14.14 SPSS analysis of variance output for the comprehension scores in the new-product evaluation study of Case 14.2.
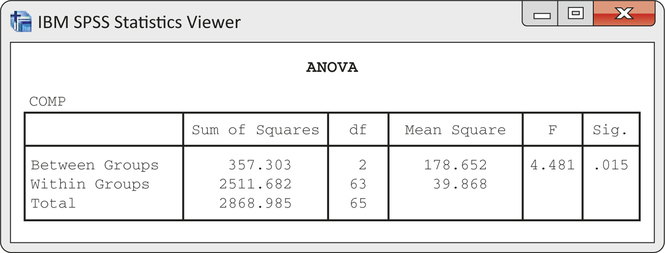
FIGURE 14.15 Normal quantile plot of the residuals for the comprehension scores in the new-product evaluation study of Case 14.2.
[Leave] [Close]