EXAMPLE 14.21 Using Software
eduprod
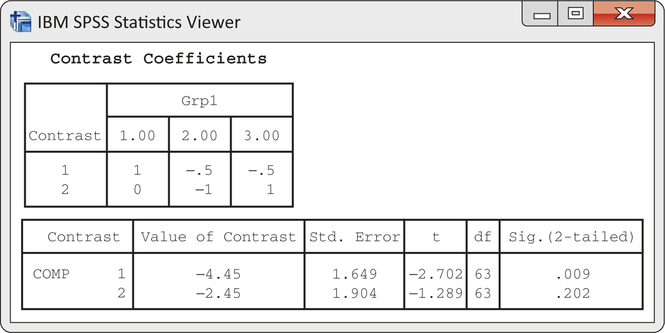
CASE 14.2 Figure 14.16 displays the SPSS output for the analysis of these contrasts. The column labeled “t” gives the statistics 2.702 and 1.289 for our two contrasts. The degrees of freedom appear in the column labeled “df” and are 63 for each . The -values are given in the column labeled “Sig. (2-tailed).” These are correct for two-sided alternative hypotheses. The values are 0.009 and 0.202. To convert the computer-generated results to apply to our one-sided alternative concerning , simply divide the reported -value by 2 after checking that the value of is in the direction of (that is, that is positive).

Figure 14.16: FIGURE 14.16 SPSS output for contrasts for the comprehension scores in the new-product evaluation study of Case 14.2.