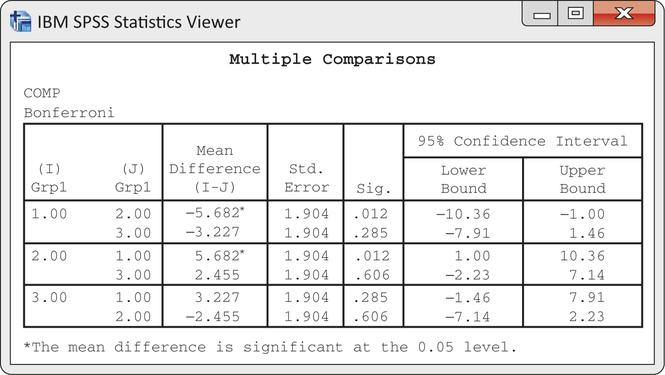
EXAMPLE 14.24 Computer Output for Multiple Comparisons
eduprod
CASE 14.2 The output from SPSS for Bonferroni comparisons appears in Figure 14.17. The first line of numbers gives the results for comparing Basal with DRTA, Groups 1 and 2. The difference between the means is given as −5.682 with a standard error of 1.904. The -value for the comparison is given under the heading “Sig.” The value is 0.012. Therefore, we could declare the means for Basal and DRTA to be different according to the Bonferroni procedure as long as we are using a value of that is less than or equal to 0.012. In particular, these groups are significantly different at the overall level. The last two entries in the row give the Bonferroni 95% confidence interval. We discuss this later.
