Question 14.53
14.53 Organic foods and friendly behavior?
Refer to Exercise 14.51 for the design of the experiment. After rating the moral transgressions, the participants were told “that another professor from another department is also conducting research and really needs volunteers.” They were told that they would not receive compensation or course credit for their help and then were asked to write down the number of minutes (out of 30) that they would be willing to volunteer. This sort of question is often used to measure a person’s prosocial behavior.
organic
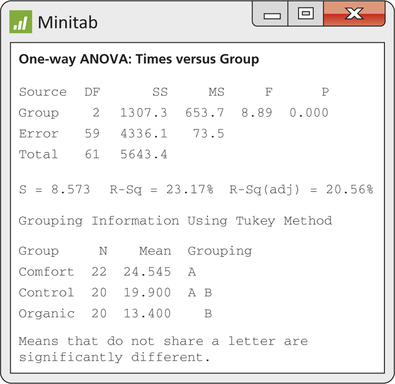
- Figure 14.19 contains the Minitab output for the analysis of this response variable. Write a one-paragraph summary of your conclusions.
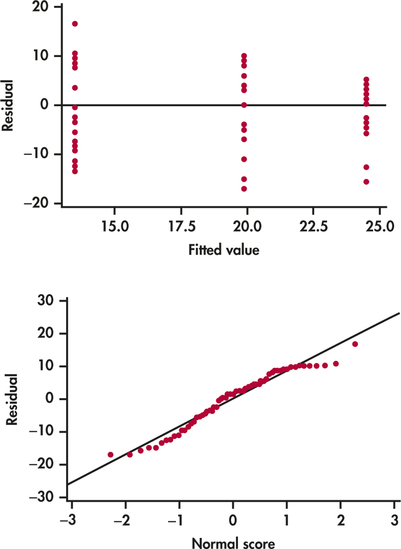
- Figure 14.20 contains a residual plot and a Normal quantile plot of the residuals. Are there any concerns regarding the assumptions necessary for inference? Explain your answer.


14.53
(a) not all of the are equal, . There are significant differences in the number of minutes that the three groups are willing to volunteer. According to the Tukey multiple comparison, the Comfort group is willing to donate significantly more minutes than the Organic group. In other words, the Comfort group shows more prosocial behavior than the Organic group. The Control group is in the middle, not significantly different from either the Comfort or Organic group in the number of minutes they are willing to donate. (b) The residual plot shows a slight decrease in variability, suggesting a possible violation of constant variance. The Normal quantile plot looks fine and shows a roughly Normal distribution.