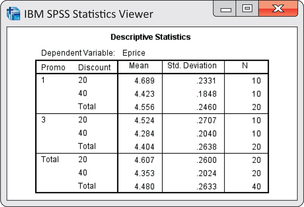
EXAMPLE 15.12 Means and Standard Deviations
freqd1
CASE 15.1 The software output in Figure 15.6 gives descriptive statistics for the data of Case 15.1. In the row with 1 under the heading “Promo” and 20 under the heading “Discount,” the mean of the 10 observations in this treatment combination is given as 4.689. The standard deviation is 0.2331. We would report these as 4.69 and 0.23. The next row gives results for one promotion and a 40% discount. The marginal results for all 20 students assigned to one promotion appear in the following “Total” row. The marginal standard deviation 0.2460 is not useful because it ignores the fact that the 10 observations for the 20% discount and the 10 observations for the 40% discount come from different populations. The overall mean for all 40 observations appears in the last row of the table. The standard deviations for the four groups are quite similar, and we have no reason to suspect a serious violation of the condition that the population standard deviations must all be the same.
