EXAMPLE 15.8 Per Capita Income, Continued
The American Community Survey in fact reports per capita income for four regions of the United States. Here are the data:
| Region | White | Asian | Mean |
| Midwest | $28,528 | $29,166 | $28,847 |
| Northeast | $35,192 | $32,295 | $33,744 |
| South | $28,455 | $30,246 | $29,351 |
| West | $30,264 | $31,176 | $30,720 |
| Mean | $30,610 | $30,721 | $30,665 |
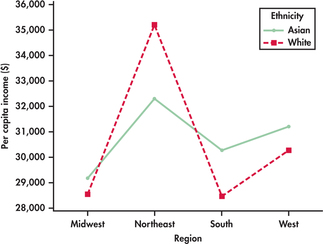
Including the additional regions changes the marginal means for ethnicity and the overall mean of all groups. Figure 15.2 is a plot of the group means. There is a clear main effect for region: the per capita income of both white and Asian individuals is highest in the Northeast and West. The plot does not show a clear main effect for ethnicity because of the Northeast region. In all other regions, a person of Asian descent has a larger per capita income, but in the Northeast, the Asian per capita income is lower. As a result, the two lines are not parallel, indicating that an interaction is present. When there is interaction, main effects can be meaningful and important, but this is not always the case. For example, the main effect of region is meaningful despite the interaction, but the main effect of ethnicity is not as clear because of the interaction.
15-10
