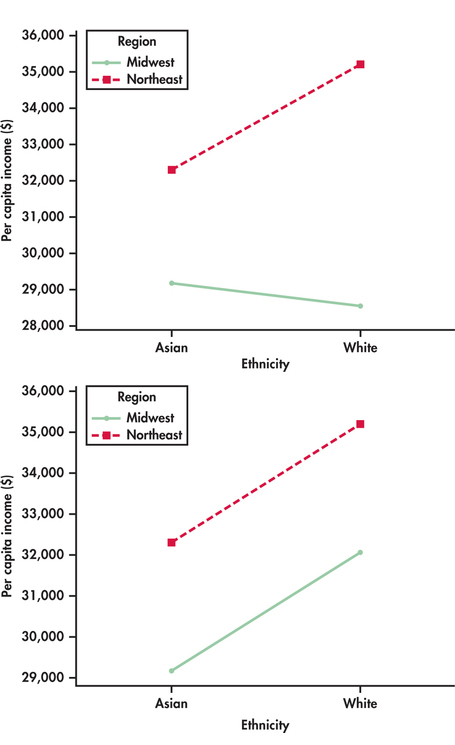
Figure 15.1: FIGURE 15.1 (a) Plot of per capita incomes for individuals of white or Asian descent in two U.S. regions, Example 15.7. Interaction between ethnicity and region is visible in the lack of parallelism of the lines. (b) The plot as it would appear if there were no interaction. The ethnicity lines are now parallel.