EXAMPLE 16.2 The -value
used
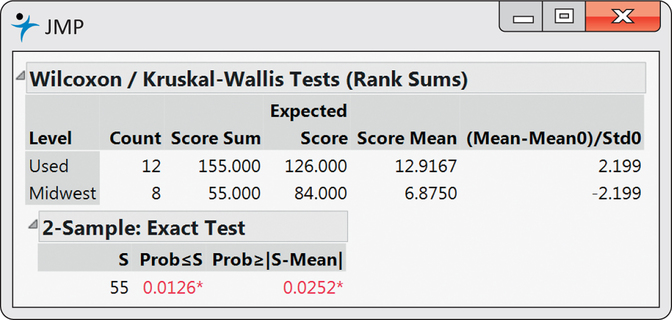
CASE 16.1 Figure 16.3 shows the output from JMP that calculates the exact sampling distribution of W. We see that the sum of the ranks in the first group (Used Auto) is . The reported one-sided -value is 0.0126. It should be noted that the software computed the -value based on the sum of ranks for the second group which is 55. It is reporting the probability that the sum of ranks for Midwest Auto consumers is at most as large as 55. This is equivalent to the probability that the sum of ranks for Used Auto consumers is at least as large as 155.

Figure 16.3: FIGURE 16.3 Output from JMP for the data in Case 16.1. JMP provides the option of reporting the -value for the exact distribution of .