EXAMPLE 16.7 Loss of Product Value: Rank Test
vitc
In the vitamin loss study of Example 16.6, n=9. If the null hypothesis (no systematic loss of vitamin C) is true, the mean of the signed rank statistic is
μW+=n(n+1)4=(9)(10)4=22.5
Our observed value W+=34 is somewhat larger than this mean. The one-sided P-value is P(W+≥34).
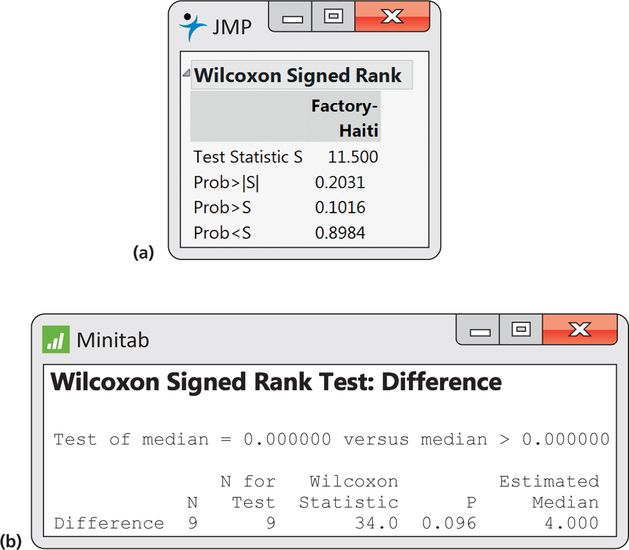
Figure 16.6 displays the output of two statistical programs. We see from Figure 16.6(a) that the one-sided P-value is P=0.1016. JMP reports a statistic S as being 11.5. This is simply the difference between W+ and μW+. This small sample does not give convincing evidence of vitamin loss.
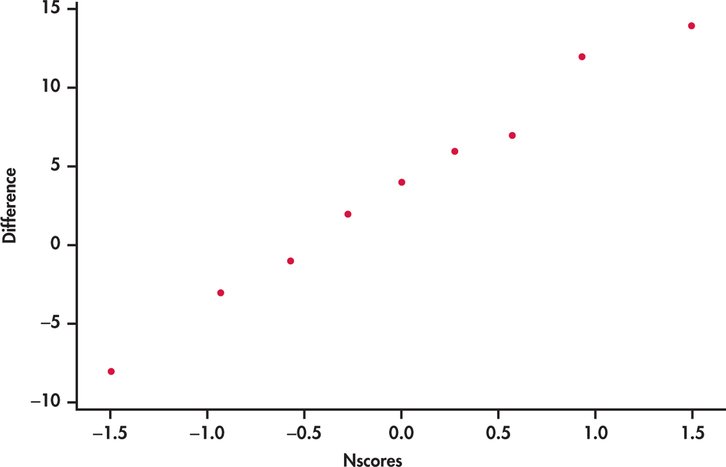
In fact, the Normal quantile plot in Figure 16.7 shows that the differences are reasonably Normal. We could use the paired-sample t to get a similar conclusion (t=1.5595, df=8, P=0.0787). The t test has a slightly lower P-value because it is somewhat more powerful than the rank test when the data are actually Normal.

