EXAMPLE 16.9 Two Rounds of Golf Scores
golf
Here are the golf scores of 12 members of a college women’s golf team in two rounds of tournament play. (A golf score is the number of strokes required to complete the course, so that low scores are better.)
16-20
| Player | 1 | 2 | 3 | 4 | 5 | 6 | 7 | 8 | 9 | 10 | 11 | 12 |
| Round 2 | 94 | 85 | 89 | 89 | 81 | 76 | 107 | 89 | 87 | 91 | 88 | 80 |
| Round 1 | 89 | 90 | 87 | 95 | 86 | 81 | 102 | 105 | 83 | 88 | 91 | 79 |
| Difference | 5 | −5 | 2 | −6 | −5 | −5 | 5 | −16 | 4 | 3 | −3 | 1 |
Negative differences indicate better (lower) scores on the second round. We see that six of the 12 golfers improved their scores. We would like to test the hypotheses that in a large population of collegiate woman golfers
- : scores have the same distribution in rounds 1 and 2
- : scores are systematically lower or higher in round 2
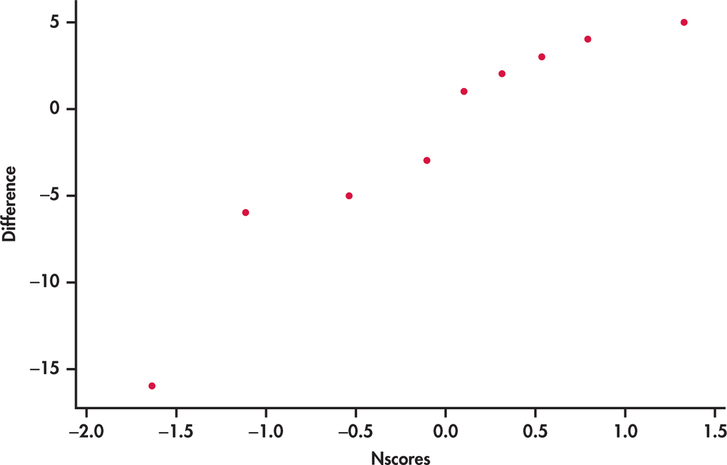
A Normal quantile plot of the differences (Figure 16.8) shows some irregularity and a low outlier. We will use the Wilcoxon signed rank test.

Figure 16.8: FIGURE 16.8 Normal quantile plot of the differences in scores for two rounds of a golf tournament, Example 16.9.