EXAMPLE 17.10 Predicting a Movie's Profitability
movprof
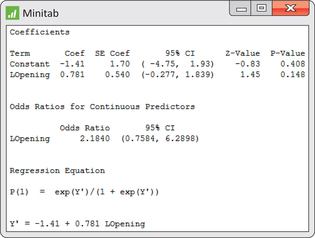
Figure 17.7 gives the output from Minitab for a logistic regression analysis using log opening-weekend revenue as the explanatory variable. The fitted model is
This agrees up to rounding with the result reported in Example 17.6.
From the output, we see that because , we cannot reject the null hypothesis that the slope . The value of the test statistic is , calculated from the estimate and its standard error . Minitab reports the odds ratio as 2.184, with a 95% confidence interval of (0.7584, 6.2898). Notice that this confidence interval contains the value 1, which is another way to assess . In this case, we don't have enough evidence to conclude that this explanatory variable, by itself, is helpful in predicting the probability that a movie will be profitable.
17-15
