EXAMPLE 17.11 Multiple Logistic Regression
movprof
As in Example 17.10, we predict the odds that a movie will be profitable. The explanatory variables are log opening-weekend revenue (LOpening), the length of the movie (Minutes), and the movie rating (Rating1). For the movie rating, we use an indicator variable
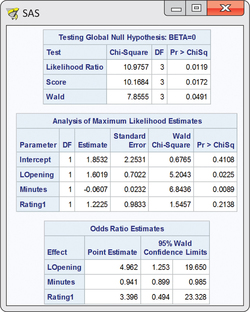
Figure 17.8 gives the SAS output. From the output, we see that the fitted model is

17-17
When analyzing data using multiple regression, we first examine the hypothesis that all the regression coefficients for the explanatory variables are zero. We do the same for logistic regression. The hypothesis
is tested by a chi-square statistic with three degrees of freedom. SAS provides results for three different calculations of this statistic. In all three approaches, the -value is . We reject and conclude that one or more of the explanatory variables can be used to predict the odds that the movie is profitable.
Next, examine the coefficients for each variable and the tests that each of these is 0 in a model that contains the other two. The -values are 0.0225, 0.0089, and 0.2138. The null hypothesis cannot be rejected. That is, log opening-weekend revenue and the movie's length add significant predictive ability once the other two explanatory variables are already in the model.