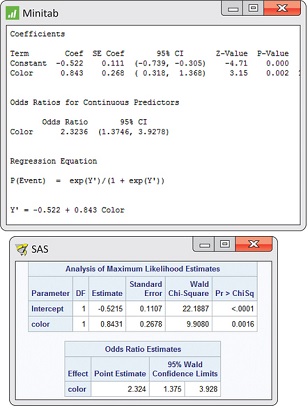
EXAMPLE 17.7 Computer Output for Tipping Study
red
CASE 17.1 Figure 17.3 gives the output from Minitab and SAS for the tipping study. The parameter estimates match those we calculated in Example 17.4. The standard errors are 0.1107 and 0.2678. A 95% confidence interval for the slope is
b1±z*SEb1=0.8431±(1.96)(0.2678)=0.8431±0.5249
We are 95% confident that the slope is between 0.3182 and 1.368. Both Minitab and SAS output provide the odds ratio estimate and 95% confidence interval. If this interval is not provided, it is easy to compute from the interval for the slope β1:
(eb1−z*SEb1,eb1+z*SEb1)=(e0.3182⋅e1.368)=(1.375,3.927)

We conclude, “Servers wearing red are more likely to be tipped than servers wearing a different color (odds ratio=2.324, 95% CI=1.375 to 3.928).”