EXAMPLE 17.8 Effectiveness of an Insecticide
insect
As part of a cost-effectiveness study, a wholesale florist company ran an experiment to examine how well the insecticide rotenone kills an aphid called Macrosiphoniella sanborni that feeds on the chrysanthemum plant.3 The explanatory variable is the concentration (in log of milligrams per liter) of the insecticide. About 50 aphids each were exposed to one of five concentrations. Each insect was either killed or not killed. Here are the data, along with the results of some calculations:
| Concentration x (log scale) |
Number of insects |
Number killed |
Proportion killed ˆp |
Log odds |
| 0.96 | 50 | 6 | 0.1200 | −1.9924 |
| 1.33 | 48 | 16 | 0.3333 | −0.6931 |
| 1.63 | 46 | 24 | 0.5217 | 0.0870 |
| 2.04 | 49 | 42 | 0.8571 | 1.7918 |
| 2.32 | 50 | 44 | 0.8800 | 1.9924 |
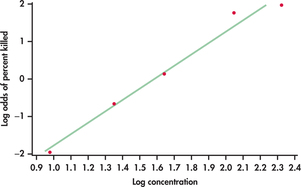
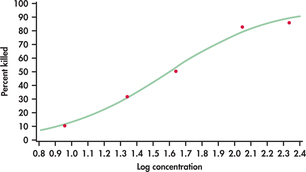
Because there are replications at each concentration, we can calculate the proportion killed and estimate the log odds of death at each concentration. The logistic model in this case assumes that the log odds are linearly related to log concentration. Least-squares regression of log odds on log concentration gives the fit illustrated in Figure 17.4. There is a clear linear relationship, which justifies our use of the logistic model. The logistic regression fit for the proportion killed appears in Figure 17.5. It is a transformed version of Figure 17.4 with the fit calculated using the logistic model rather than least squares.

