EXAMPLE 17.9 Does Concentration Affect the Kill Rate?
insect1
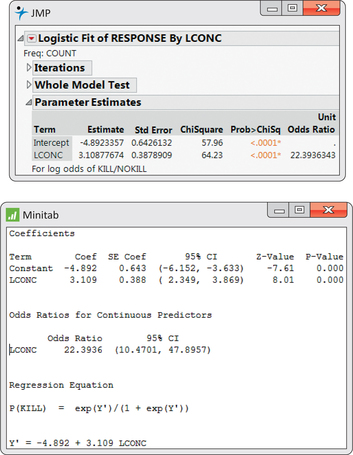
Figure 17.6 gives the output from JMP and Minitab for logistic regression analysis of the insecticide data. The model is
17-14
where the values of the explanatory variable are 0.96, 1.33, 1.63, 2.04, 2.32. From the JMP output, we see that the fitted model is
or
Figure 17.5 is a graph of the fitted given by this equation against , along with the data used to fit the model. JMP gives the statistic under the heading “ChiSquare.” The null hypothesis that is clearly rejected (, ).
The estimated odds ratio is 22.394. An increase of one unit in the log concentration of insecticide () is associated with a 22-fold increase in the odds that an insect will be killed. The confidence interval for the odds is given in the Minitab output: (10.470, 47.896).
Remember that the test of the null hypothesis that the slope is 0 is the same as the test of the null hypothesis that the odds ratio is 1. If we were reporting the results in terms of the odds, we could say, “The odds of killing an insect increase by a factor of 22.3 for each unit increase in the log concentration of insecticide (, ; 95% ).”