Question 2.125
2.125 Look at the residuals
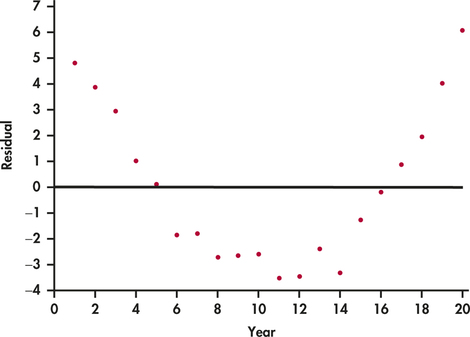
Refer to the previous exercise. Figure 2.25 is a plot of the residuals versus year.
raises
- Interpret the residual plot.
- Explain how this plot highlights the deviations from the least-squares regression line that you can see in Figure 2.24.

Figure 2.25: FIGURE 2.25 Plot of residuals versus year for an individual who receives approximately a 5% raise each year for 20 years, Exercise 2.125.
2.125
(a) The data are not linear; a curve is a better fit. (b) The residual plot emphasizes the curve seen in the scatterplot.