EXAMPLE 3.20 Do the Randomization for the Utility Company Experiment Using Excel
In the utility company experiment of Example 3.19, we must assign 60 residences to three treatments. First we generate the labels. Let’s use numerical labels and keep a separate file that gives the residence address for each number. So for Step 1, we will use these labels, 1 to 60:
To illustrate Step 2, we will show several Excel files. To see what we are doing, it will be easier if we reduce the number of residences to be randomized. So, let’s randomize 12 residences to the three treatments. Our labels are
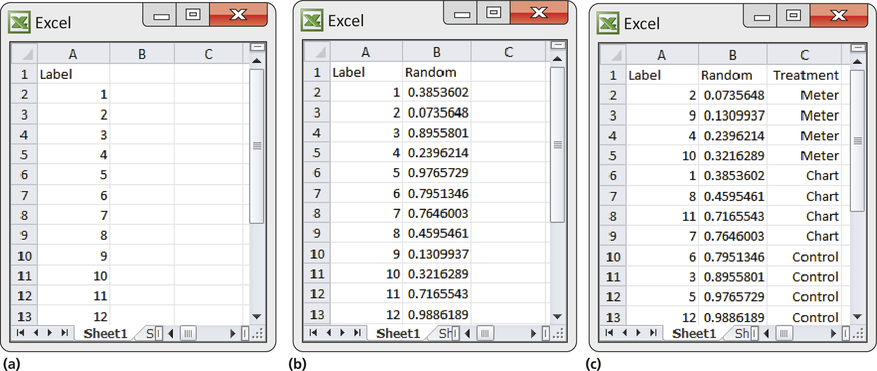
For the first part of Step 2, we create an Excel file with the numbers 1 to 12 in the first column. This file is shown in Figure 3.7(a). Next, we use the RAND() function in Excel to generate 12 random numbers in the second column. The result is shown in Figure 3.7(b). We then sort the file based in the random numbers. We create a third column with the following treatments: “Meter” for the first four, “Chart” for the next four, and “Control” for the last four. The result is displayed in Figure 3.7(c).
