EXAMPLE 4.1 Coin Tossing
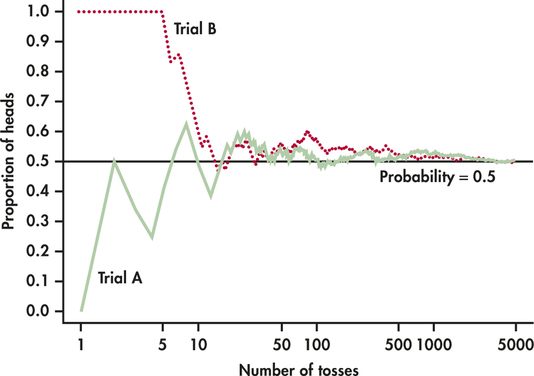
When you toss a coin, there are only two possible outcomes, heads or tails. Figure 4.1 shows the results of tossing a coin 5000 times twice. For each number of tosses from 1 to 5000, we have plotted the proportion of those tosses that gave a head. Trial A (solid line) begins tail, head, tail, tail. You can see that the proportion of heads for Trial A starts at 0 on the first toss, rises to 0.5 when the second toss gives a head, then falls to 0.33 and 0.25 as we get two more tails. Trial B, on the other hand, starts with five straight heads, so the proportion of heads is 1 until the sixth toss.

175
The proportion of tosses that produce heads is quite variable at first. Trial A starts low and Trial B starts high. As we make more and more tosses, however, the proportion of heads for both trials gets close to 0.5 and stays there. If we made yet a third trial at tossing the coin 5000 times, the proportion of heads would again settle down to 0.5 in the long run. We say that 0.5 is the probability of a head. The probability 0.5 appears as a horizontal line on the graph.