EXAMPLE 4.26 Uniform Random numbers
The random number generator will spread its output uniformly across the entire interval from 0 to 1 as we allow it to generate a long sequence of numbers. The results of many trials are represented by the density curve of a uniform distribution.
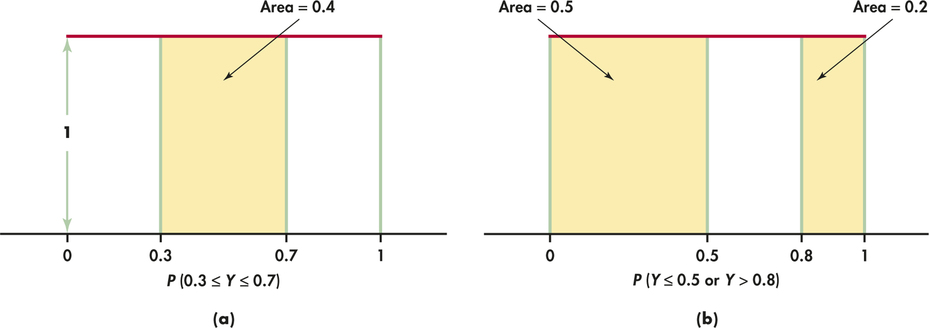
This density curve appears in red in Figure 4.12. It has height 1 over the interval from 0 to 1, and height 0 everywhere else. The area under the density curve is 1: the area of a rectangle with base 1 and height 1. The probability of any event is the area under the density curve and above the event in question.
uniform distribution
214

As Figure 4.12(a) illustrates, the probability that the random number generator produces a number between 0.3 and 0.7 is
because the area under the density curve and above the interval from 0.3 to 0.7 is 0.4. The height of the density curve is 1, and the area of a rectangle is the product of height and length, so the probability of any interval of outcomes is just the length of the interval.
Similarly,
Notice that the last event consists of two nonoverlapping intervals, so the total area above the event is found by adding two areas, as illustrated by Figure 4.12(b). This assignment of probabilities obeys all of our rules for probability.