EXAMPLE 4.34 Portfolio Analysis
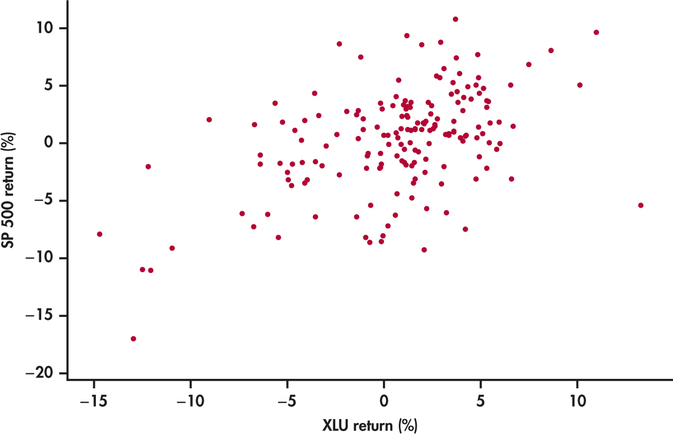
CASE 4.3 The past behavior of the two securities in the portfolio is pictured in Figure 4.18, which plots the monthly returns for S&P 500 market index against the utility sector index from January 2000 to May 2014. We can see that the returns on the two indices have a moderate level of positive correlation. This fact will be used later for gaining a complete assessment of the expected performance of the portfolio. For now, we can calculate mean returns from the 173 data points shown on the plot:29
X=monthly return for S&P 500 indexμx=0.298%Y=monthly return for Utility indexμy=0.675%

By combining Rules 1 and 2, we can find the mean return on the portfolio based on a 70/30 mix of S&P index shares and utility shares:
R=0.7X+0.3YμR=0.7μX+0.3μY=(0.7)(0.298)+(0.3)(0.675)=0.411%
This calculation uses historical data on returns. Next month may, of course, be very different. It is usual in finance to use the term expected return in place of mean return.