Figure 4.18:
FIGURE 4.18
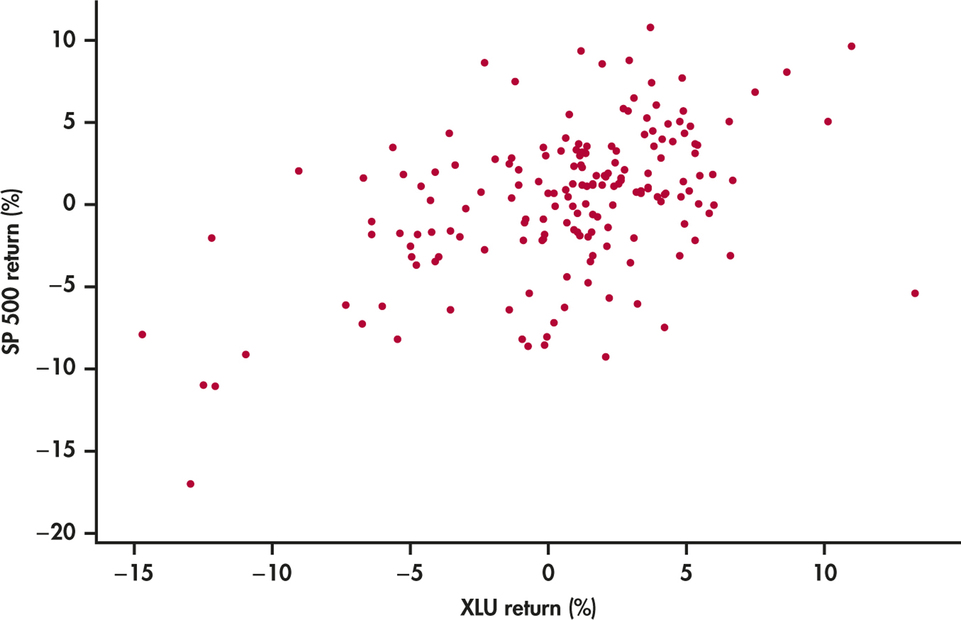
Monthly returns on S&P 500 index versus returns on Utilities Sector index (January 2000 to May 2014),
Example 4.34
.