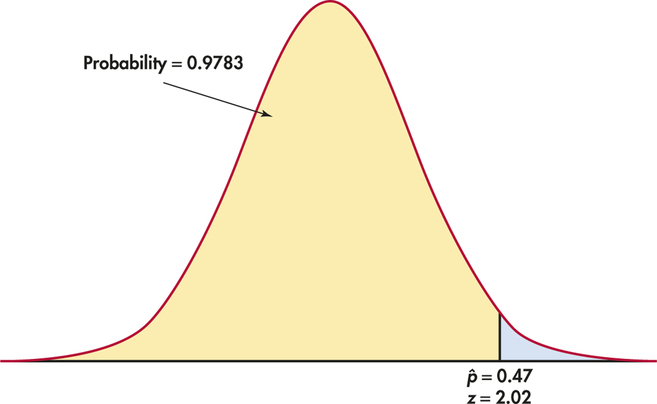
EXAMPLE 5.13 Compare the Normal Approximation with the Exact Calculation
Let’s compare the Normal approximation for the calculation of Example 5.11 (page 255) with the exact calculation from software. We want to calculate P(ˆp≤0.47) when the sample size is n=2500 and the population proportion is p=0.45. Example 5.12 (page 256) shows that
μˆp=p=0.45σˆp=√p(1−p)n=0.0099
Act as if ˆp were Normal with mean 0.45 and standard deviation 0.0099. The approximate probability, as illustrated in Figure 5.5, is
P(ˆp≤0.47)=P(ˆp−0.450.0099≤0.47−0.450.0099)=P(Z≤2.02)=0.9783
That is, about 98% of all samples have a sample proportion that is at most 0.47. Because the sample was large, this Normal approximation is quite accurate. It misses the software value 0.9787 by only 0.0004.
