EXAMPLE 5.24 Sampling Distribution and Sample Size
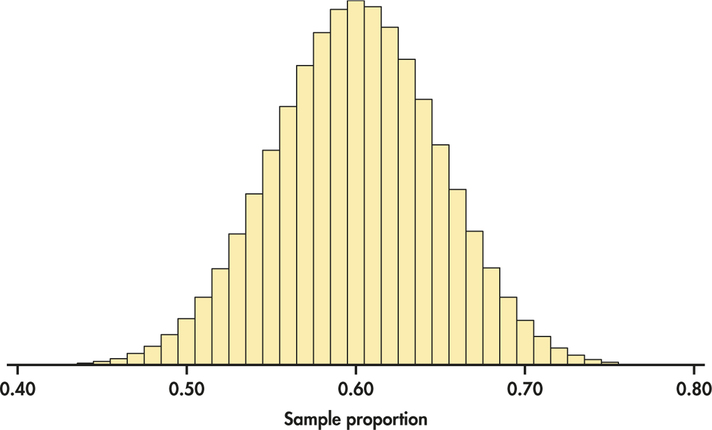
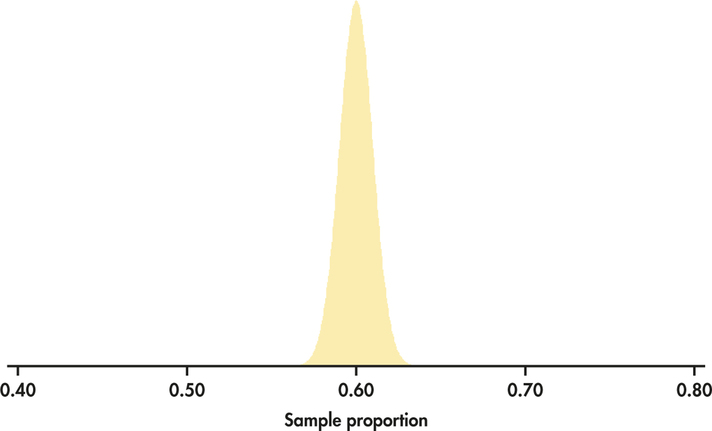
In the case of Futures Company, suppose that, in fact, 60% of the population have interest in the product. This means that . If Futures Company were to sample 100 people, then the sampling distribution of would be given by Figure 5.12. If Futures Company were to sample 2500 people, then the sampling distribution would be given by Figure 5.13. Figures 5.12 and 5.13 are drawn on the same scale.

Figure 5.12: FIGURE 5.12 Sampling distribution for sample proportions with and .

Figure 5.13: FIGURE 5.13 Sampling distribution for sample proportions with and drawn from the same population as in Figure 5.12. The two sampling distributions have the same scale. The statistic from the larger sample is less variable.
We see that both sampling distributions are centered on . This again reflects the lack of bias in the sample proportion statistic. Notice, however, the values of for samples of size 2500 are much less spread out than for samples of size 100.