EXAMPLE 6.20 Blood Pressures of Executives
The medical director of a large company is concerned about the effects of stress on the company’s younger executives. According to the National Center for Health Statistics, the mean systolic blood pressure for males 35 to 44 years of age is 128, and the standard deviation in this population is 15. The medical director examines the records of 72 executives in this age group and finds that their mean systolic blood pressure is . Is this evidence that the mean blood pressure for all the company’s young male executives is higher than the national average? As usual in this chapter, we make the unrealistic assumption that the population standard deviation is known—in this case, that executives have the same as the general population.
Step 1: Hypotheses. The hypotheses about the unknown mean of the executive population are
328
Step 2: Test statistic. The test requires that the 72 executives in the sample are an SRS from the population of the company’s young male executives. We must ask how the data were produced. If records are available only for executives with recent medical problems, for example, the data are of little value for our purpose. It turns out that all executives are given a free annual medical exam and that the medical director selected 72 exam results at random. The one-sample statistic is
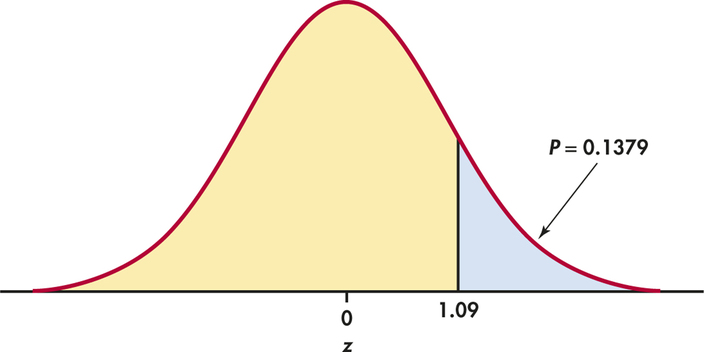
Step 3: P-value. Draw a picture to help find the -value. Figure 6.14 shows that the -value is the probability that a standard Normal variable takes a value of 1.09 or greater. From Table A we find that this probability is

Step 4: Conclusion. We could report the result as “the data fail to provide evidence that would lead us to conclude that the mean blood pressure for company’s young male executives is higher than the general population of men of the same age group (, ).”