EXAMPLE 6.8 Time between Sent Text Messages
In Example 5.19 (page 270), it was reported that Americans aged 18 to 29 years send an average of almost 88 text messages a day. Suppose that the time between text messages sent from your cell phone is governed by the exponential distribution with mean minutes and standard deviation minutes. You record the next 50 times between sent text messages. What is the probability that their average exceeds 13 minutes?
The central limit theorem says that the sample mean time (in minutes) between text messages has approximately the Normal distribution with mean equal to the population mean minutes and standard deviation
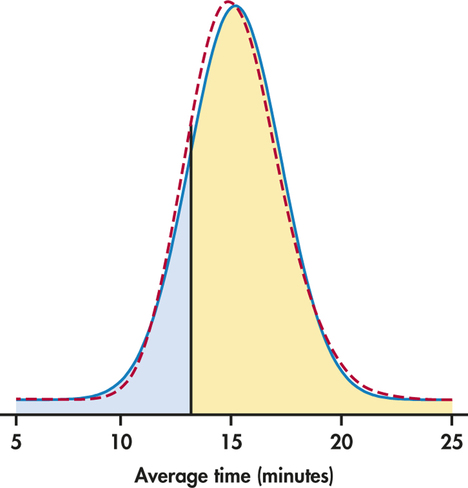
The sampling distribution of is, therefore, approximately . Figure 6.5 shows this Normal curve (solid) and also the actual density curve of (dashed).
298

The probability we want is . This is the area to the right of 13 under the solid Normal curve in Figure 6.5. A Normal distribution calculation gives
The exactly correct probability is the area under the dashed density curve in the figure. It is 0.8271. The central limit theorem Normal approximation is off by only about 0.0007.