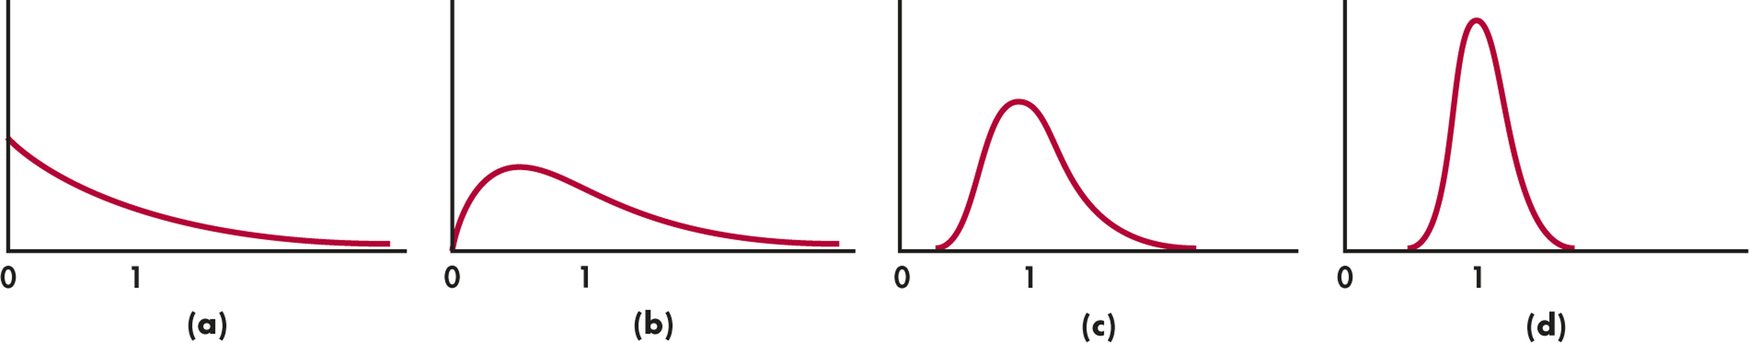
FIGURE 6.3 The central limit theorem in action: the distribution of sample means ˉx from a strongly non-Normal population becomes more Normal as the sample size increases. (a) The distribution of one observation. (b) The distribution of ˉx for two observations. (c) The distribution of ˉx for 10 observations. (d) The distribution of ˉx for 25 observations.
[Leave] [Close]