EXAMPLE 7.10 Smart Shopping Carts and Spending
smrtcrt
Smart shopping carts are shopping carts equipped with scanners that track the total price of the items in the cart. While both consumers and retailers have expressed interest in the use of this technology, actual implementation has been slow. One reason for this is uncertainty in how real-time spending feedback affects shopping. Retailers do not want to adopt a technology that is going to lower sales.
To help understand the smart shopping cart’s influence on spending behavior, a group of researchers designed a study to compare spending with and without realtime feedback. Each participant was asked to shop at an online grocery store for items on a common grocery list. The goal was to keep spending around a budget of $35. Half the participants were randomly assigned to receive real-time feedback—specifically, the names of the products currently in their cart and the total price. The non-feedback participants only saw the total price when they completed their shopping.
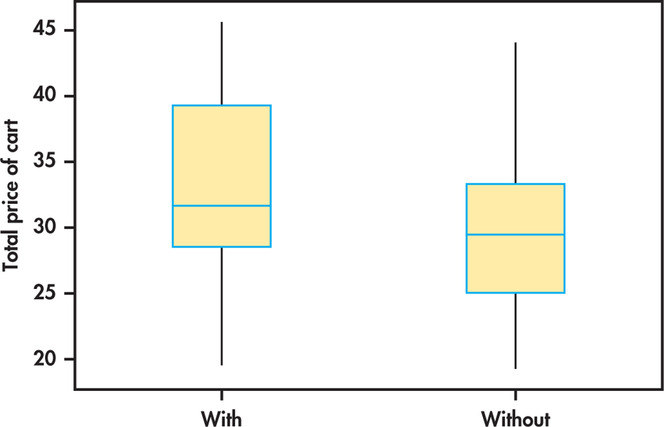
Figure 7.9 shows side-by-side boxplots of the data.20 There appears to be a slight skewness in the total price, but no obvious outliers in either group. Given these results and the large sample sizes, we feel confident in using the procedures.
In general, the participants with real-time feedback appear to have spent more than those without feedback. The summary statistics are
| Group | |||
|---|---|---|---|
| With feedback | 49 | 33.137 | 6.568 |
| Without feedback | 48 | 30.315 | 6.846 |
382

We’d like to estimate the difference in the two means and provide an estimate of the precision. Plugging in these summary statistics, the 95% confidence interval for the difference in means is
Using software, the degrees of freedom are 94.63 and . This approximation gives
The conservative approach would use the smaller of
Table D does not supply a row for but gives for . We use because it is the closest value of in the table that is less than 47. With this approximation we have
| 1.684 | 2.021 | |
| 90% | 95% | |
The conservative approach does give a wider interval than the more accurate approximation used by software. However, the difference is very small (just a nickel at each end). We estimate the mean difference in spending to be $2.82 with a margin of error of slightly more than $2.70. The data do not provide a very precise estimate of this difference.